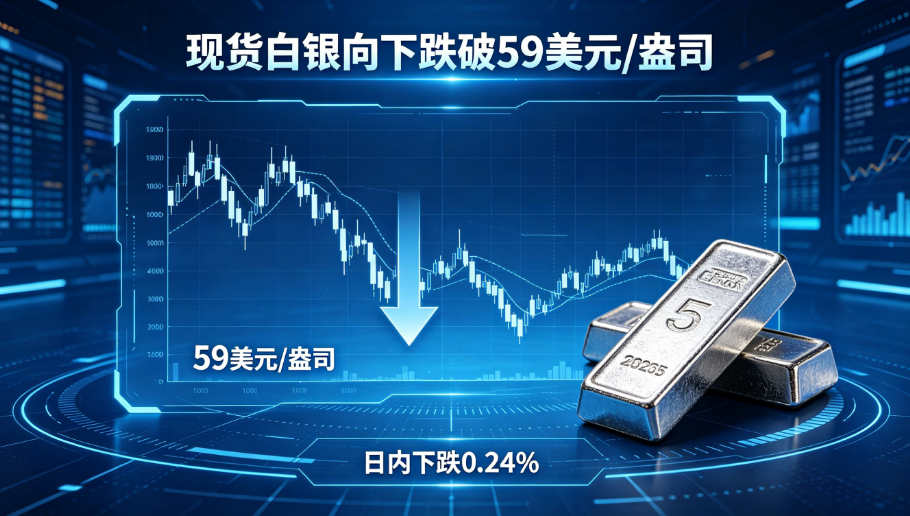


On July 24, 2026, the international precious metals market saw major positive signals. According to the latest data from the World Gold Council, global central bank net gold purchases reached 312 tons in Q2 2026, up 23% year-on-year, setting a single-quarter record. Meanwhile, driven by explosive growth in the solar and electronics industries, the silver supply-demand gap continued to widen, with spot silver prices steadily rising above $38, accumulating over 35% gains year-to-date.
Central Bank Gold Buying: Dual Drivers of De-dollarization and Hedging
Data shows the most active gold buyers in Q2 included the People's Bank of China (added 85 tons), the Reserve Bank of India (added 67 tons), and the National Bank of Kazakhstan (added 42 tons). Additionally, Poland, Turkey, and others also increased gold reserves. Analysts pointed out that the acceleration of central bank gold buying is driven by concerns over the instability of the dollar-based credit system and hedging against geopolitical risks.
Emerging Markets Lead Gold Purchases
"Emerging market central banks are shifting foreign exchange reserves from dollar assets to gold, an irreversible trend," said George Miller, Chief Analyst at London precious metals research firm Metals Focus. He further explained that the ongoing Russia-Ukraine conflict, escalating US-China trade friction, and US debt exceeding $40 trillion have all weakened the dollar's stability as a reserve currency. Gold, as a hard asset without sovereign credit risk, naturally becomes the top choice for central banks.
Gold Price Holds Above $2,600; Bullish Pattern Unchanged
Supported by central bank buying, spot gold prices broke through the $2,600 mark at the end of Q2 and stabilized around $2,645 during Asian trading on July 24. Technically, gold is steadily rising along the 20-day moving average, with the MACD golden cross expanding. Short-term resistance is at the $2,700 round number. If broken, it could challenge the all-time high of $2,750 set in 2024.
Silver Industrial Demand Surges; Supply-Demand Gap Hits Five-Year High
The driving force for the silver market comes more from the industrial sector. The latest report from the Silver Institute points out that global silver industrial demand is expected to reach 720 million ounces in 2026, up 12% from 2025, with the solar photovoltaic sector's share rising to 35%.
Solar Industry Becomes Main Silver Consumer
With the acceleration of global energy transition, the amount of silver used in solar photovoltaic panels continues to rise. Each solar cell requires about 0.1 grams of silver, and global new solar installations are expected to exceed 500GW in 2026, directly spurring a surge in silver demand. Data from the China Photovoltaic Industry Association shows that China's silver imports reached 12,000 tons in H1 2026, up 28% year-on-year, with over 60% used for solar production.
Silver ETF Holdings Rebound; Capital Continues to Flow In
On the fund flow side, the world's largest silver ETF—iShares Silver Trust (SLV)—saw its holdings increase to 18,500 tons on July 22, up 9% since the start of the year, indicating institutional investors' bullish outlook on silver. Analysts believe that silver, with dual attributes as an industrial metal and a precious metal, could challenge the $45 mark this year under the combined effect of risk aversion and industrial demand.
Gold-Silver Ratio Continues to Narrow; Arbitrage Opportunities Emerge
Notably, the gold-silver ratio (gold price divided by silver price) has narrowed from 82x at the start of the year to the current 69x, though it remains above the 10-year average of 65x. Historical experience shows that when the ratio reverts to the mean, silver tends to outperform gold. Some hedge funds have already started positioning for long silver/short gold arbitrage strategies.
Risk Warning and Trading Strategies
However, the market is not without risks. The Fed's July rate decision is imminent; if it unexpectedly sends a hawkish signal, it could trigger a short-term pullback in gold and silver. Investors are advised to watch the following key levels:
- Gold: Support at $2,580, resistance at $2,700. If it breaks below $2,580, it may test $2,520.
- Silver: Support at $36.5, resistance at $40. If it breaks above $40, the next target is $42.
Overall, driven by the dual engines of global central bank gold buying and silver industrial demand, the precious metals market's bullish structure remains solid. Investors should maintain a buy-on-dips strategy while closely monitoring geopolitical and monetary policy changes.