


Silver Loses $59: Deep Technical Analysis and Market Logic Discussion
Introduction
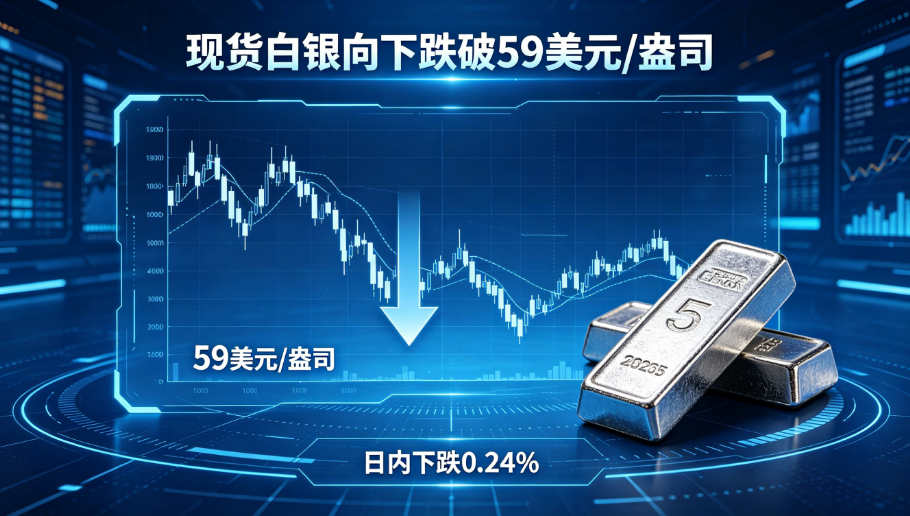
In 2024, the global precious metals market continues to fluctuate. Spot silver recently experienced a key technical breakdown. Data shows spot silver prices fell below the $59/oz mark, dropping 0.24% intraday. Although a 0.24% decline seems modest percentage-wise, the loss of the important psychological and technical support level at $59 carries significant market signals and technical implications. This article provides an in-depth analysis of this event from multiple dimensions including technical analysis, market structure, macroeconomic background, and investor behavior, aiming to present readers with a comprehensive and rigorous market picture.
Technical Level: Symbolic Meaning and Support Logic of the $59 Mark
1. Formation Mechanism of Key Support Levels
For the silver market, $59/oz is not a random number. From a technical analysis perspective, this price has repeatedly acted as both support and resistance in past trading history. Typically, an important technical level is shaped by the following factors:
- Previous Highs and Lows: Historically, silver prices have formed multiple reversal points around $59.
- Moving Average Convergence Zone: For example, $59 may coincide with the 50-day or 200-day moving average, creating technical support.
- Fibonacci Retracement Levels: If silver's retracement from a major uptrend high lands near 61.8% or 50%, it carries strong technical significance.
When prices break below $59, these technical support logics fail in the short term, and bearish forces dominate the market.
2. Technical Pattern Analysis After the Breakdown
This breakdown is not an isolated event. Observing silver's daily chart reveals a clear downward channel since the price fell from earlier highs. The loss of $59 can be seen as an effective penetration of the lower channel boundary, strengthening the short-term bearish trend.
Regarding technical indicators, the Relative Strength Index may have entered weak territory (e.g., below 40), while the MACD may have formed a death cross signal, and the histogram shows negative expansion. These indicators collectively point to a phase of technical correction or deeper pullback for silver.
3. Verification from Volume and Open Interest
When prices break below a key support with increased volume, it indicates strong consensus among market participants, suggesting sustainability of the decline. Conversely, a decline with shrinking volume may be a false breakout or technical trap. Investors should monitor volume changes on the day and subsequent days.
Additionally, the Commodity Futures Trading Commission's Commitment of Traders report is worth noting. A significant reduction in speculative net long positions would further confirm the shift in market sentiment.
Market Logic: Interplay of Macro Factors and Supply-Demand Dynamics
1. Pressure from the US Dollar and Interest Rates
As a dollar-denominated precious metal, silver has a significant negative correlation with the US dollar. Recently, strong US economic data has increased expectations that the Federal Reserve will maintain high interest rates or even raise them further, pushing the dollar index higher. A strong dollar raises the opportunity cost of holding silver, suppressing investment demand.
Additionally, rising real interest rates pressure silver. Since silver generates no interest, its attractiveness declines relative to interest-bearing assets like bonds in a rising rate environment, leading to fund outflows from precious metals.
2. Dual Pressure from Industrial Demand and Safe-Haven Attributes
Unlike gold, silver's industrial demand accounts for over 50% of total demand. The current uneven pace of global economic recovery, especially fluctuations in economic data from major manufacturing countries like China, has sparked concerns about the outlook for industrial metals demand. This concern directly impacts silver prices, subjecting them to greater downward pressure than gold.
On the other hand, despite ongoing geopolitical risks, safe-haven flows primarily go to gold rather than silver. Silver's "quasi-currency" attribute is weaker than gold, and it often lags with greater volatility during risk-off periods.
3. Subtle Shifts in Supply-Demand Structure
On the supply side, global silver mine output is growing slowly, with some mines even reducing production. On the demand side, while photovoltaic silver usage is a long-term positive, it cannot offset the weakness in investment and jewelry demand in the short term. Coupled with persistently high exchange inventories (e.g., COMEX and Shanghai Futures Exchange silver inventories), ample spot supply also provides conditions for price declines.
Investor Behavior and Market Sentiment Analysis
Every price breakdown is a concentrated release of investor psychology. The loss of the $59 level may trigger the following market behaviors:
- Entry of Trend Traders: After a technical breakdown, quantitative strategies and trend followers will increase short positions, accelerating the price decline.
- Surge of Stop-Loss Orders: Stop-loss orders placed near $59 are activated, intensifying short-term selling pressure.
- Passive Exit of Longs: Investors holding long silver positions choose to cut losses or reduce positions after the key level is broken, tilting market liquidity toward the bearish side.
Market sentiment shifts often have inertia. Once a downtrend is established, a stronger catalyst is needed to reverse expectations. Therefore, even if macroeconomic fundamentals turn positive, it may take time for silver to recover above $59.
Conclusion and Outlook
Spot silver's fall below $59/oz, although only a 0.24% intraday drop, carries technical and market implications far beyond the number itself. This breakdown marks a short-term victory for bearish forces and reflects the convergence of multiple factors including the macro interest rate environment, weak industrial demand, and shifting investor sentiment.
Looking ahead, the direction of silver prices will depend on the following key variables:
- Fed Policy Path: If monetary policy signals easing, the dollar weakens, and silver could rebound.
- Inflection Point in Industrial Demand: Whether the global economy stabilizes and recovers, particularly the strength of China's manufacturing recovery, will determine the performance of silver's industrial attribute.
- Technical Repair Capability: Whether silver can form new effective support in the $55-57 range and gradually recover above $59 is key for the medium-term trend.
For investors, the current market environment demands more cautious strategies. Short-term operations should focus on risk control, waiting for clear trend reversal signals; long-term investors can focus on production cost support and long-term industrial demand growth, deploying in batches at relatively low prices.
In summary, the breakdown of the $59 level is not an endpoint but the start of a new phase in the market. Only by deeply understanding the logic behind the price can investors remain invincible amid silver market fluctuations.